
From Stats To Stories: The Power Of Infographics In Women’s Basketball
Originally published May 19, 2024
For most organizations, including women’s basketball, infographics are a powerful way to relay information. Whether it’s presenting stats, the upcoming schedule, new players or anything else, putting a visual to the information makes it easier to understand.
Many college and professional women’s basketball teams use infographics as a key way to communicate with their fan base. Here are some examples of teams who have used this data visualization well.

Purdue
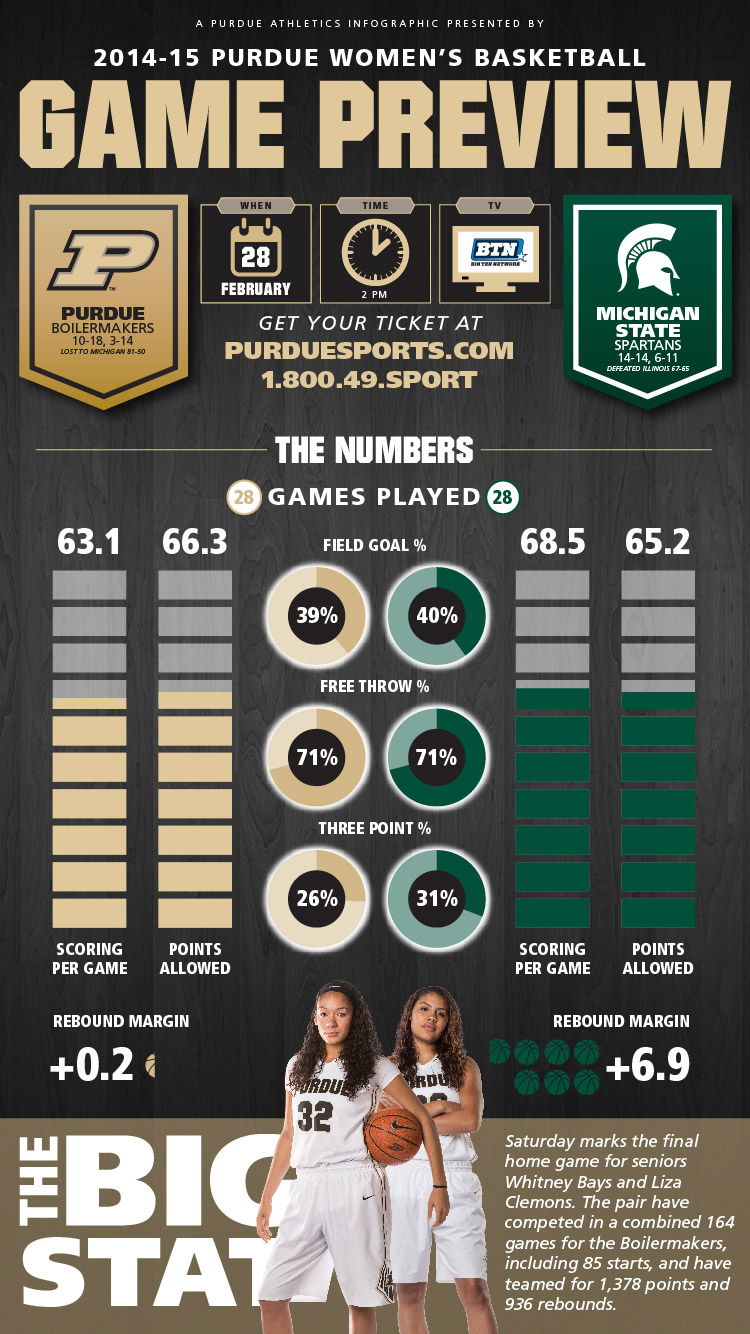
This Purdue women’s basketball game day infographic is about the team’s matchup against Michigan State. This infographic aims to get fans excited about the game and how evenly matched the two teams are. All the visual statistics for each team look very similar and it seems intentional. It shows fans that there is a good chance this game will be close which will make people want to come watch. This is a great example of an effective infographic communicating a rivalry between two teams and creating a buzz around an upcoming game.
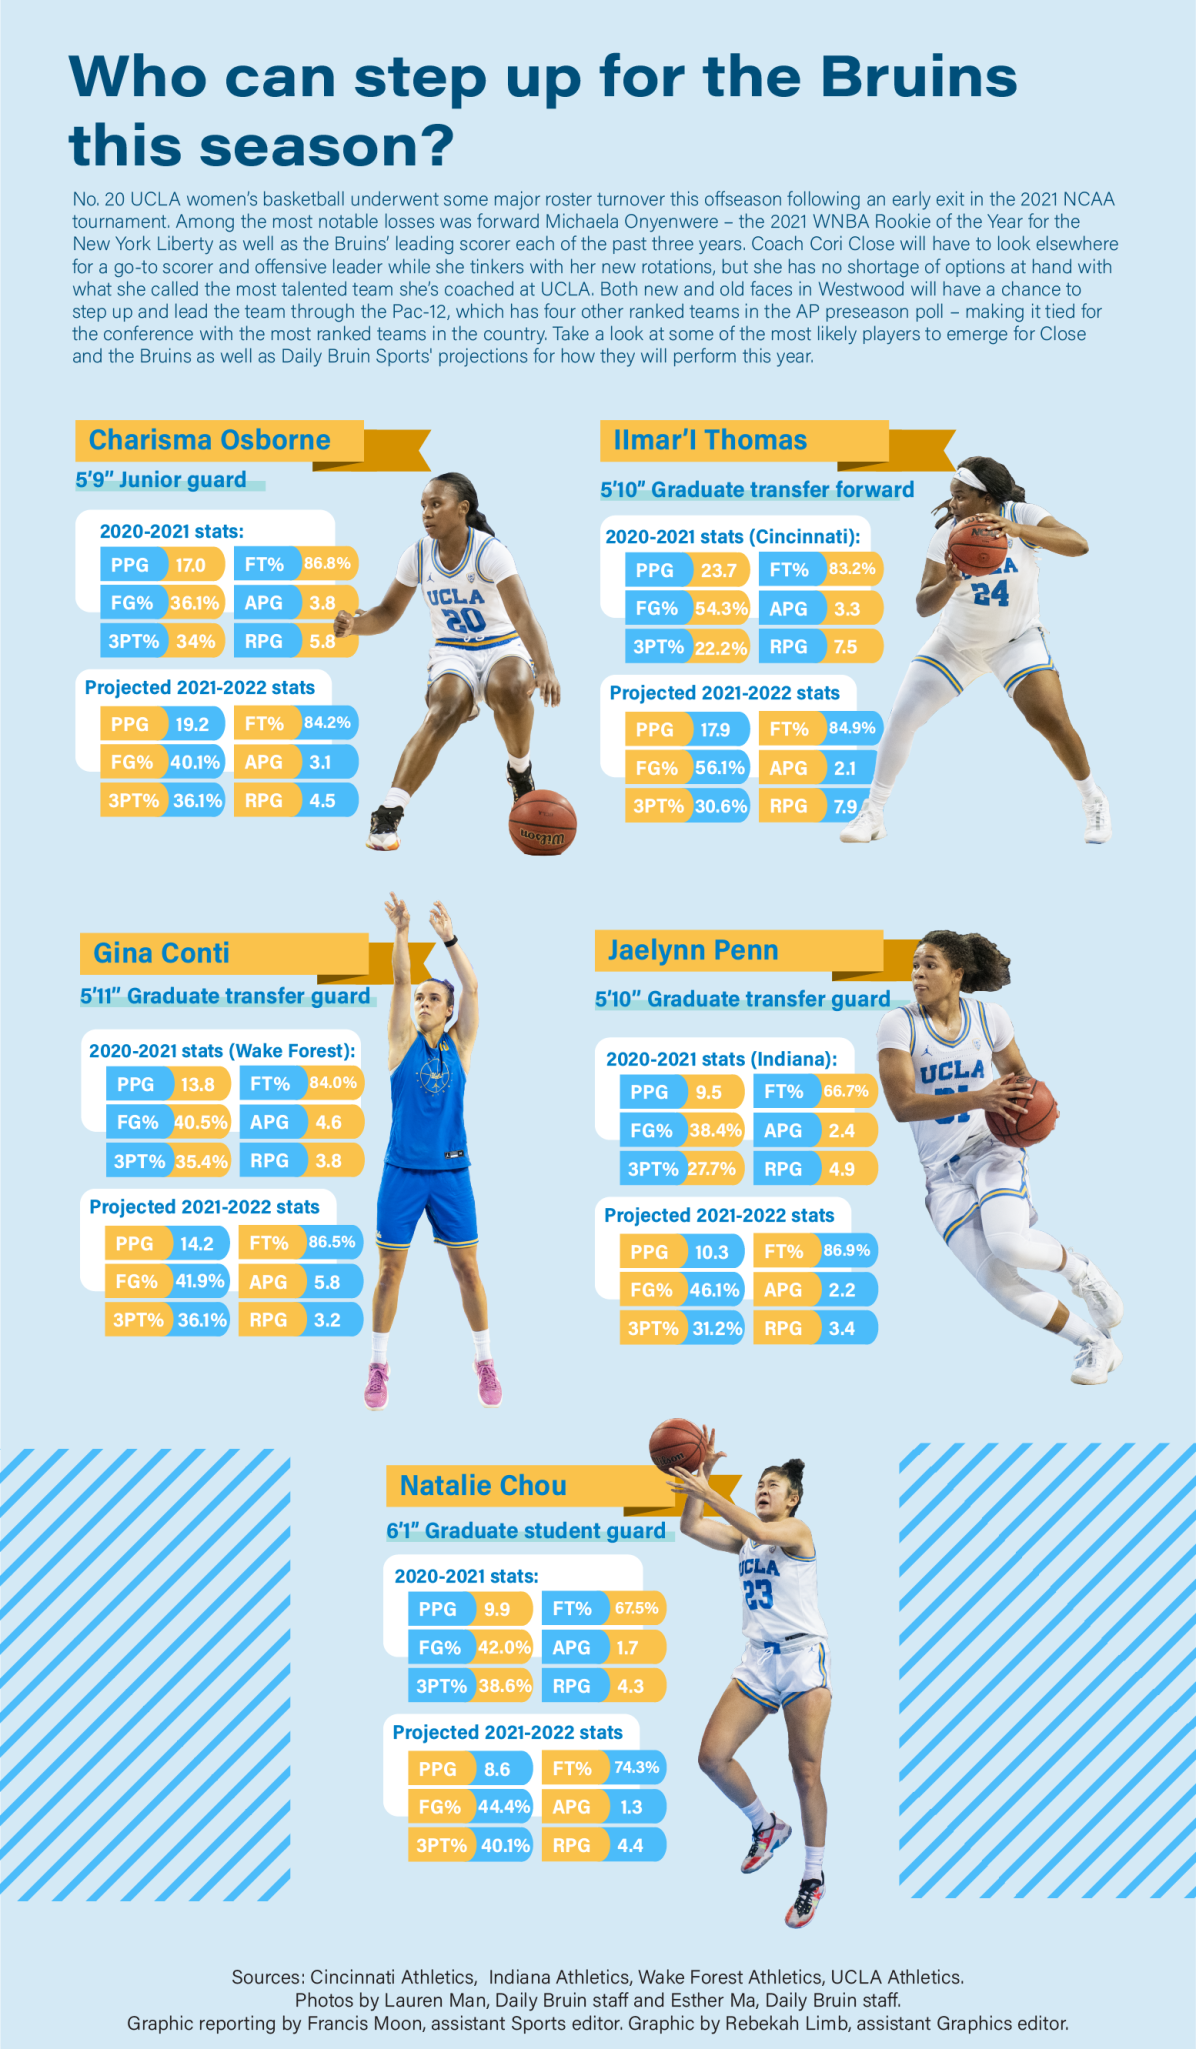
UCLA
UCLA’s approach to infographics is to get fans excited for each player of the season. The visuals help fans put a face to each player’s name and show them what they can expect from the women this season. The stats are easy to read and allow fans to decide who they think the next UCLA star will be. This is a good way for the school to get fans excited for the upcoming season and communicate that some extremely talented women are playing. The infographic conveys the message that this season is one fans won’t want to miss.
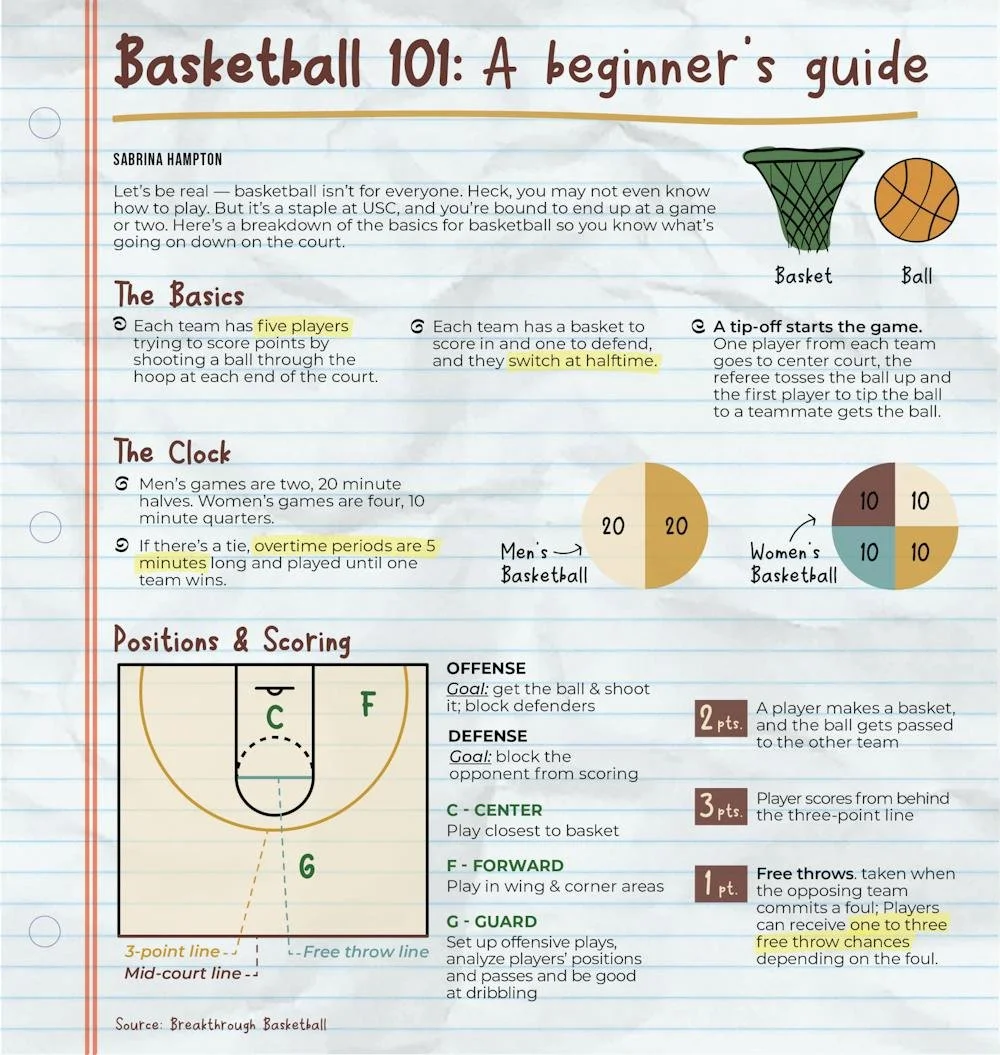
University of South Carolina
This University of South Carolina newspaper took a completely different approach to infographics by taking fans back to the basics. Basketball is a confusing game to watch and it takes a long time to learn how to play. Going to watch a sport you know nothing about isn’t fun for most people and this infographic helps solve the problem. By breaking down the game of basketball into easily digested pictures and words it creates an opportunity for new fans to arise.
These infographics illustrate three unique ways to talk about women’s basketball. Each school had the goal to draw more fans in when creating these visuals but they went about it in three completely different ways. Infographics like these are an example of strategic communication because it’s a faster way to convey information. Looking at a visual is quick and easy which is why so many teams use infographics like these. These three examples are just some of the many effective ways women’s basketball teams get fans excited for upcoming games or seasons.